Simple but effective reporting
WaiterOS shows all your key metrics in one dashboard. Use WaiterOS’s reporting to compare months and identify opportunities for improvement, mastering statistics such as new vs. returning guests.
What’s your no-show rate? Which acquisition channels are least successful? And what promotion is outperforming? Our reporting reveals it all.
WaiterOS shows all your key metrics in one dashboard. Use WaiterOS’s reporting to compare months and identify opportunities for improvement, mastering statistics such as new vs. returning guests.
See when it gets busy, who visits your widget and how you’re doing compared with last week.
See the total number of visitors to your reservation widget and the number per week.
1,248
visitors in total
212
this week
See the score per category and read what guests wrote after their visit.
8.9
/ 10
average
Lovely food, especially the main courses.
Friendly and quick.
A cozy evening.
Fair prices for what you get.
See how many guests come for the first time and how many come back.
63%
returning guests
See whether things are going better than last week, for example in reservations, guests or no-shows.
Reservations
96
↑ 8%Guests
287
↑ 11%New guests
54
↑ 5%Returning guests
233
↓ 1%No-show rate
3.1%
↓ 0.9 ptReview score
8.9
↑ 0.2Average party size
3.0
↑ 0.1Cancellations
8
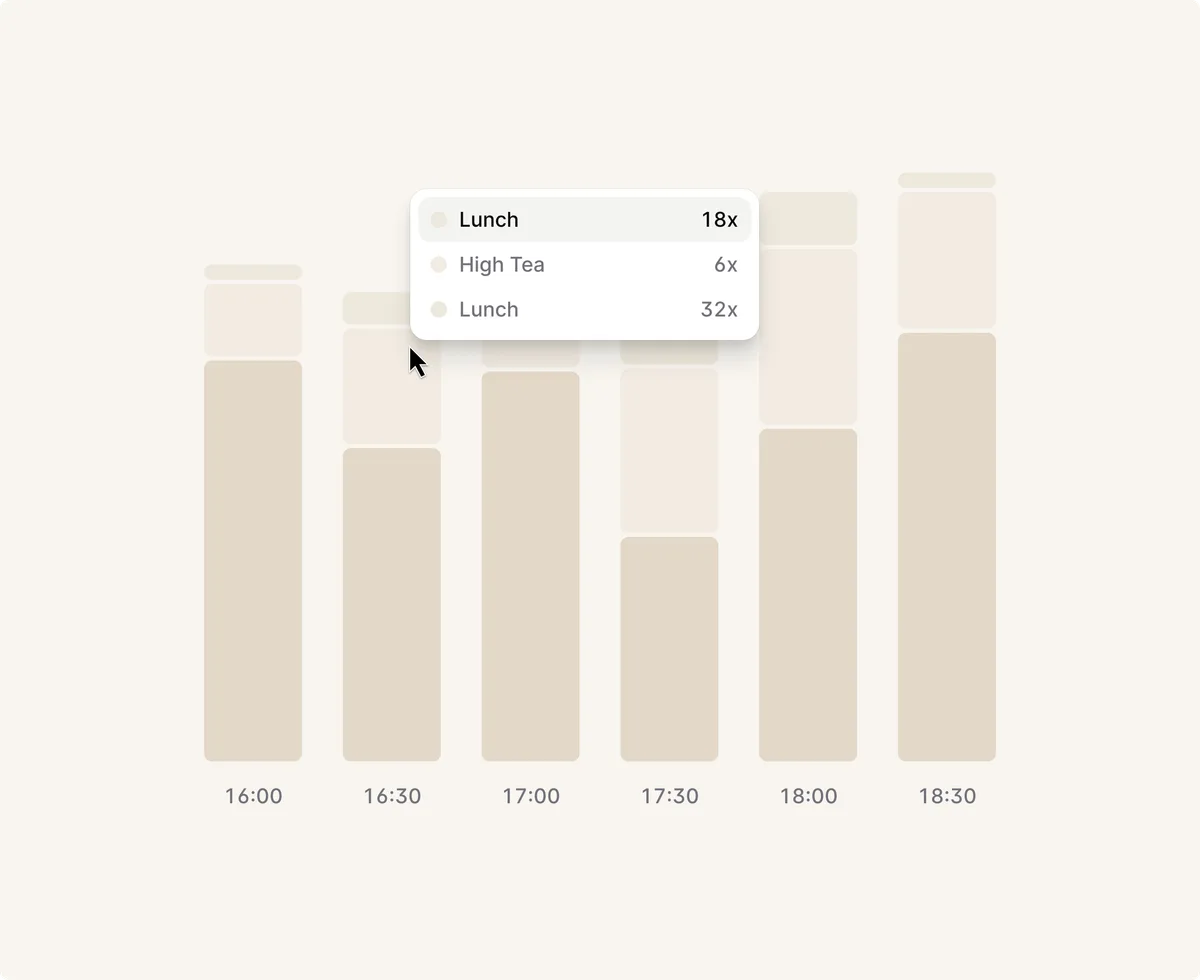
↓ 6%See at which moments of the day most guests come, and for every date which times can still be booked.
19:00
48 guests
Problems cost you money. We handle yours with people who know your market and speak your language.
Get in touch at any time
Chat day or night – in your own language
Real experts
Help straight from our developers
Customer service
Chat with usStart right away, or switch from another system. We move all your data over for you.